2022 Quail Roadside Survey Results and Quail Hunting Outlook
By Tell Judkins, Upland Game Biologist
More than 30 years ago, the Oklahoma Department of Wildlife Conservation began conducting roadside surveys to monitor quail numbers throughout the state. There are 83 routes, each 20 miles long, surveyed in August and October in all counties except Oklahoma and Tulsa counties.
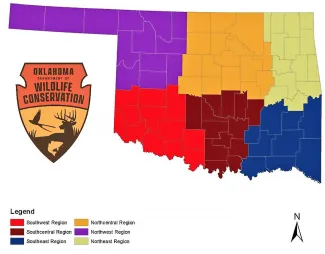
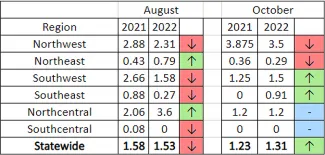
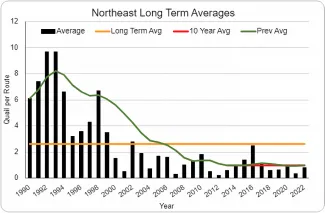
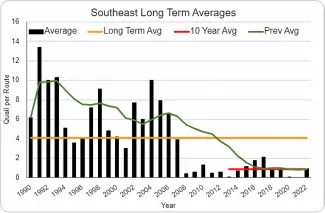
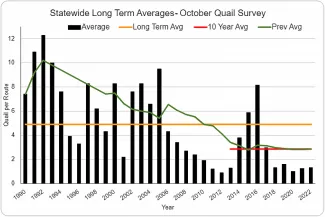
August surveys give biologists an idea of breeding success, while October surveys reveal a glimpse of recruitment for the fall hunting season. Typically, August survey numbers are a less reliable hunting season predictor than October’s because some chicks won’t survive the summer. Long-term and year-to-year trends are important for sportspeople and biologists alike. The past decade has seen survey numbers cycle, starting at the lowest recorded on these surveys in 2012 and slowly rising to a peak in 2016 that quickly fell back to previous lows. The data are analyzed in two ways: by region (Figure 1/Table 1) and by ecoregion (Figure 2/Table 2). This year, the surveys indicated the statewide average for quail numbers is up by about 6 percent over 2021.
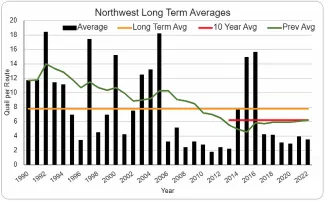
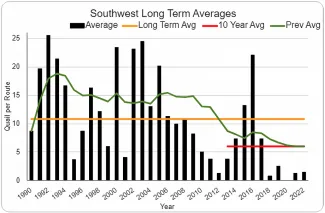
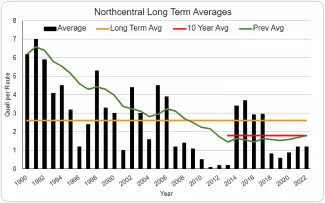
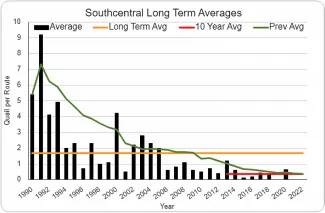
Regionally, the August survey numbers in the northeast and north-central regions were up over 2021’s survey numbers. However, the southeast and southwest regions showed increases over 2021’s numbers in October surveys (Table 1). Figures 4-10 show the average survey results from 1990 to 2022. This year, these graphs include a rolling 10-year average, shown as “Prev Avg,” to help readers visualize the change in numbers over longer periods.
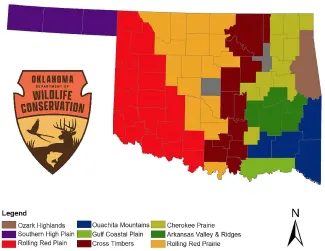
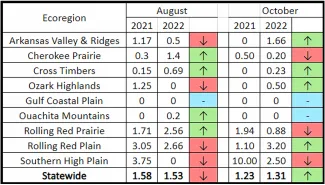
When the statewide numbers are considered by ecoregion, it becomes apparent what areas are producing better or worse year-to-year (Table 2 and Figure 3). On an ecoregion basis, the Rolling Red Plain had the largest increase this year. Looking at data by both grouping methods can help show fluctuations in quail numbers.
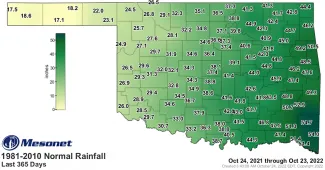
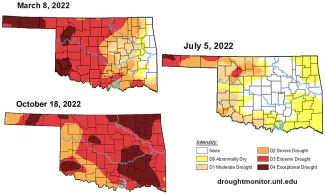
The past year has brought with it several challenges. Last year’s season saw mild drought conditions make hunting rough. As winter continued, the drought worsened with severe cold fronts. Spring saw some reprieve for most of the state, but the far southwest and Panhandle saw little rain. It wasn’t until June that those areas finally received some relief, but it was short-lived (Figures 11-12). Flash drought hit as the summer heat quickly set in. Areas in the southwest saw up to 66 days over 100 degrees F, and a majority of the state saw 90-138 days over 90 degrees F. Intermittent rains allowed much of the state to produce decent crops of forbs and insects, but overall nesting season was very dry. Currently, more than 99 percent of the state is in at least severe drought, and more than 82 percent in extreme drought (Figure 13).
According to limited observation data from the Game Brood Survey App created by Oklahoma State University and ODWC, it appears quail nesting season started in early June, with a majority of observations coming in mid-July. Age structure of observed bobwhites shows 63.6 percent full grown, 20 percent three-fourths grown, 12.7 percent half grown, and 3.6 percent one-fourth grown. This structure shows a decent early hatch but may also demonstrate how drought stress led to repeated nest attempts.
No scaled quail were observed during the 2022 surveys. There are only a few routes in Oklahoma with the opportunity to observe scaled quail. Therefore, this is strictly an observation and not a prediction of scaled quail abundance. ODWC biologists have received several reports of scaled quail broods in the Panhandle.
This year, ODWC is again collecting wings from harvested quail on public lands to better evaluate the quail population. Hunters who harvest a bird from a wildlife management area with a wing box are encouraged to place one wing from each harvested quail (whichever one wing is least damaged) into a provided envelope, write answer to questions on the envelope, and place it in the collection box. The WMAs that have boxes are Beaver River, Canton, Cooper, Cross Timbers, Kaw, Packsaddle, Pushmataha, and Sandy Sanders. Your participation in this data collection effort provides vital information about nesting success and timing, and helps improve the management of these game birds.
Season Outlook: In summary, hunters taking to the field will likely find patches of fair quail numbers where reproduction was not as severely impacted by weather and habitat remains in favorable condition. Hunting will not be what it was at the last observed peak in production in 2016. But hunters can expect to find birds throughout the state. This year’s quail season opens Nov. 12, 2022, and runs until Feb. 15, 2023. Hunters are allowed 10 quail daily.
Regulation Change: Quail season on Wildlife Department-managed land: Closed to non-resident hunting Feb. 1-15, 2023, on many western Wildlife Management Areas. Consult the Special Area Regulations on page 55 of the Oklahoma Fishing and Hunting Regulations.
For more regulations and other information consult the Oklahoma Fishing and Hunting Regulations online at https://www.wildlifedepartment.com/hunting/regs or in print wherever hunting and fishing licenses are sold.
Ultimately, remember the outdoors are always open! Work some ground, trust your dog, and make a few memories!